Quarterly Real Estate Reports for
Antioch, Brentwood, Oakley, Discovery Bay, Pittsburg, and Bay Point, California
Updated January 20th, 2020
Market Statistics Report for the 4th Quarter of 2019
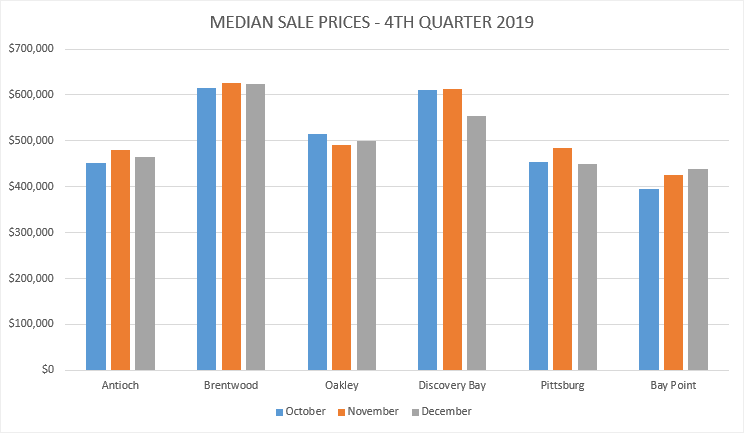
2019 ends with home prices up, down and flat. Inventory of homes on the market historically low.

Mortgage interest rates continue low!
What does all that mean for you? Read our full real estate market report article for the full story.
Updated October 15th, 2019
Market Statistics Report for the 3rd Quarter of 2019
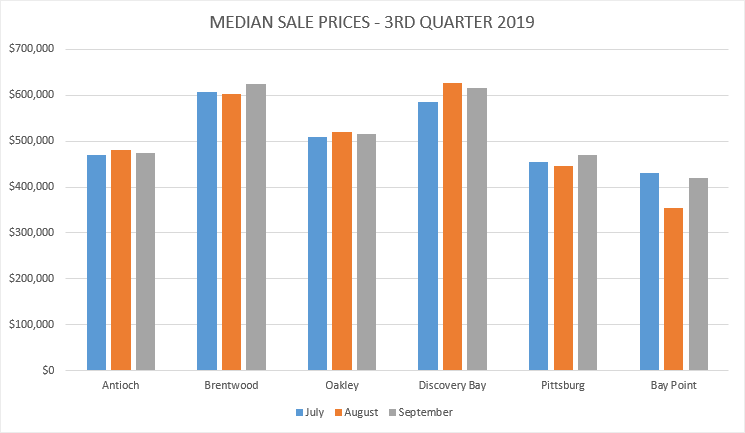
There are new market developments to report. The inventory of homes on the market is now going down, and price increases appear to be leveling off.
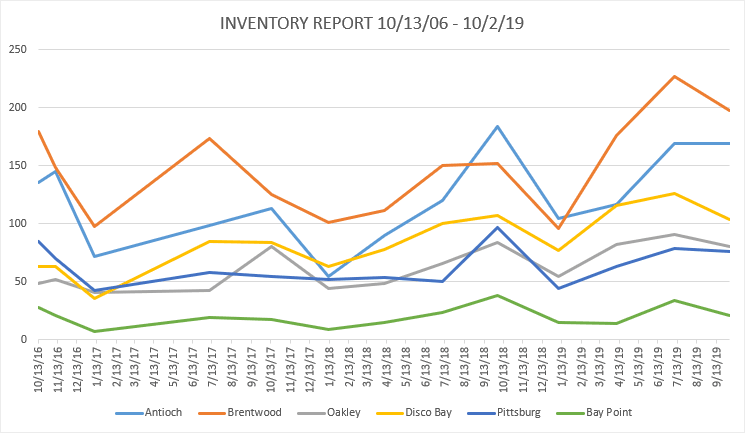
Homes are staying on the market longer, and sellers reducing their asking prices.
Mortgage interest rates continue to stay low, with fixed rates generally under 4%, and variable rates just above 4%.
What does all that mean for you? Read our full market report article for the full story.
Updated July 10th, 2019
Market Statistics Report for the 2nd Quarter of 2019

Mortgage interest rates continue on their way down while the inventory of homes on the market continues to rise.
Prices in most communities continue to rise.
A last-minute surge in buyer activity has been observed.
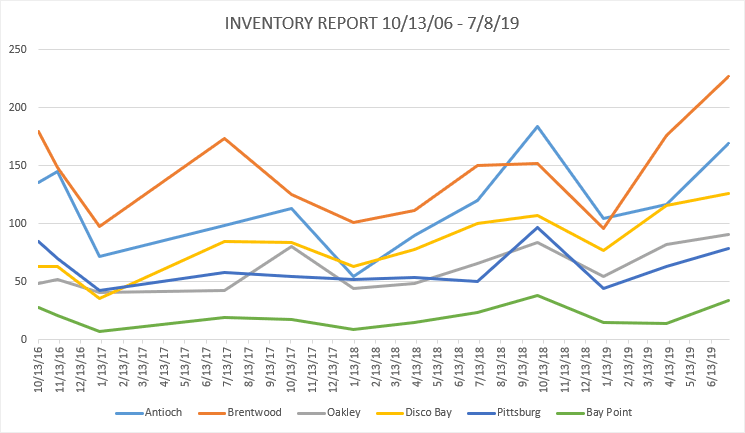
The inventory of homes on the market has increased considerably. In some cities, it has nearly doubled! (See the chart above.)
What does all that mean for you? Read our full market report article for the full story.
Updated April 16th, 2019
Market Statistics Report for the 1st Quarter of 2019

Mortgage interest rates are back down again.
Inventory of homes on the market is significantly higher in the first quarter.
More home sellers selling! More home buyers buying!
Home prices increased in the first quarter slightly.

The inventory of homes on the market has increased considerably. In some cities, it has nearly doubled! (See the chart above.)
What does all that mean for you? Read our full market report article for the full story.
Updated January 14th, 2019
Market Statistics Report for the 4th Quarter of 2018
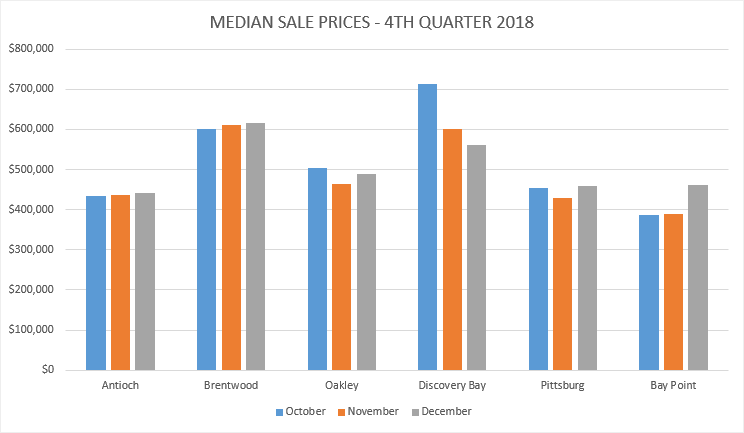
Well, 2018 saw a lot happening in the real estate market!
Sale prices up, but the rate of increase is really slowing.
The Inventory of homes for sale in the housing market first went up then went down.
Mortgage interest rates went up and then have gone down.
(Sounds a little like a roller coaster to me. 😉)

What does all that mean for you? Read our full market report article for the full story.
Updated October 16th, 2018
Market Statistics Report for the 3rd Quarter of 2018

We are now past the third quarter of the year and inventory is up for the third straight quarter. Not just up, but dramatically up!
The market turn we have been expecting is now upon us!
Price rises are slowing, houses are staying on the market longer and in many cases, prices are being reduced in order to sell.

What happens when a real estate market does this?
Find out by reading the Real Estate Market Change Report for October 2018
Updated July 16th, 2018
Market Statistics Report for the 2nd Quarter of 2018

Let’s see where we stand at the halfway point through 2018.
Median prices in all markets continue to rise, though not as dramatically as previously.
In my last summary, I noted that Oakley had surpassed Antioch in median price. That remains the case.
Oakley is still ahead of Antioch. Interestingly, Pittsburg is now neck and neck with Antioch. Let’s see how this goes.
Bay Point is all over the place. One month up, next month down. Sometimes dramatic differences. There’s just not enough sales in a month in Bay Point to get a good feel. The overall trend is up over the first six months of 2018 though.
Inventory of homes on the market has increased again in all markets except Pittsburg since last quarter. That’s two quarters in a row now. Pittsburg was down by only 4 units though. We are hoping this trend continues!
Updated April 16, 2018
Market Statistics Report for the 1st Quarter of 2018
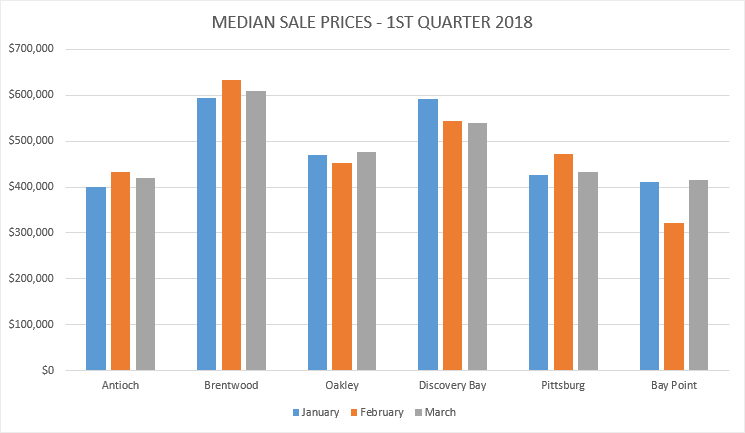
Well, the first quarter of 2018 is past now, and we can look at market stats for that period.
Median prices in all markets continue to rise. However, after bouncing around up and down a bit over a number of months, Antioch, Discovery Bay, and Pittsburg are up just a little bit.
After keeping an eye on the stats of Antioch vs Oakley all last year and the first quarter of this year, Oakley has definitely surpassed Antioch in median prices. It used to be the other way around.
The slow down in price increases at the high end in all markets continues. We are also seeing homes at that range closing for less than initial asking prices. However, a quick look at asking prices reveals that sellers are initially listing their homes for much higher than the market will allow. They end up having to come down if they are serious about selling.
Inventory of homes on the market has increased for the first time since October of last year. The numbers are not huge, but they are up in all markets. We will, of course, continue to watch those numbers as they are key indicators of the type of market at any time.
Updated January 2018
Market Statistics Report for 2017 and the 4th Quarter of 2017


2017 is behind us now and the numbers are in. Median prices in all markets ended up higher at the end of the year.
I need to point out one anomaly in our table and graph. Please disregard the December median price for Discovery Bay. There were a couple houses that sold for over a million dollars. They are of course, at the highest end of the market out there. Since there were only 18 sales in Discovery Bay that month, it really skewed the numbers.
The slow down in price increases at the high end in all markets continues. We are also seeing homes at that range closing for less than initial asking prices. However, a quick look at asking prices reveals that sellers are initially listing their homes for much higher than the market will allow. They end up having to come down if they are serious about selling.
Inventory of homes on the market continues to be at historically low levels. New home builders continue to increase building to take advantage of the need for buyers to find something they can buy.
Updated July 18, 2017
Market Statistics Report for the 2nd Quarter 2017

Median prices in all markets continued up during the second quarter this year. The rise was a bit steadier than the first quarter. Inventory of homes on the market continues to be very low. New home builders continue to increase building to take advantage of the need for buyers to find something they can buy.
There is one development that really stands out. Though median prices are up, we are seeing this is not the case at the high end of the market out here. In fact, at the high end of the market they have actually fallen in the last quarter. Homes in the asking price area of $775,000 and above have been sitting on the market for quite some time and sellers have had to reduce prices to find buyers.
We are watching to see if this is a temporary phenomenon or if it will continue. It is possible prices at that end have topped out and need to find a new market price.
Updated April 18, 2017
Market Statistics Report for the 1st Quarter 2017

Median prices are up in the first quarter of this year compared to the last quarter of last year. You may remember during our year-end report for last year that at that time prices were up in all markets except for Antioch, which had seen a bit of a slide. Well, now Antioch has made up for the slide and moved ahead.
Also at the end of last year, Bay Point was kind of up and down and looking for a trend. It has now found its trend and is edging up.
Inventory of homes on the market continues to be very low. We are seeing new home builders responding to seller demand by accelerating construction of new homes. New home prices are edging up as well.
Market Statistics Report for 2016
What happened in our real estate market in 2016 for East Contra Costa County California?
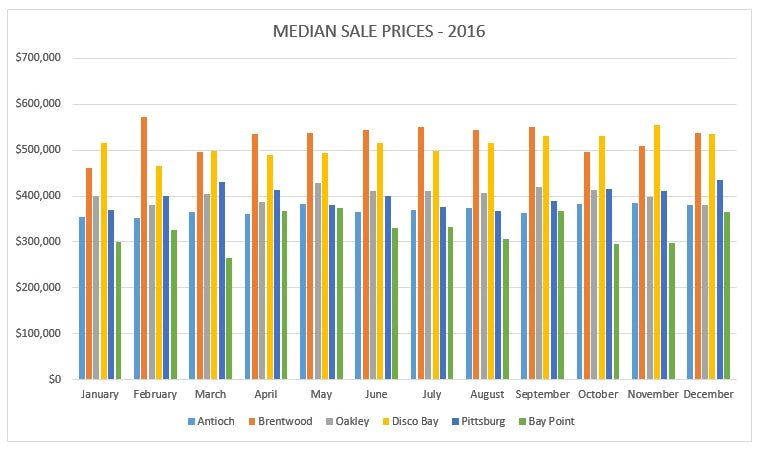
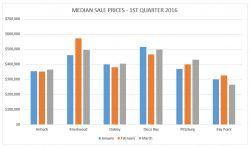
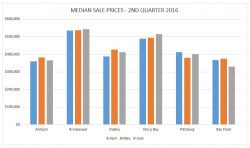
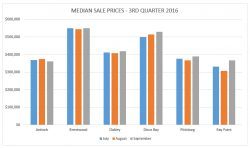
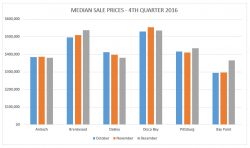
As you can see from the graph, median sales prices basically went up over the course of the year. However, the increase was not straight-line growth.
The key to consider here is if prices were up at the end of 2016. We can definitely say yes to that except for Oakley. The last two months of the year showed a bit of a decline.
Click on any thumbnail image above to view the Quarterly Median Sales Prices for 2016
In addition, prices went up more quickly in the first half of the year than the last half, with a few exceptions.
You may have heard that home sale prices have reached or even passed where they were at the very height of the market before they dropped. That is true in many parts of the Bay Area, but not in Far East County.
Check out our feature Video Presentation on the Market Review for 2016
Low Inventory of Homes
One dramatic statistic from 2016 has been the sudden drop in the inventory of homes for sale in the last quarter of 2016 and into early 2017. Antioch, in particular, went from 137 homes for sale in August 2016 to 67 homes for sale as of mid-February 2017 which puts Antioch close to its historic low.
[Tweet “Low Inventory of Homes may be Driving Prices Higher in 2017 #realestate”]
Why is the amount of inventory of homes for sale important? Lower inventory generally corresponds to a greater increase in home prices. More buyers competing for fewer houses which tend to drive prices up.
Again, we noticed price increases slowing in the second half of 2016. But very close to the end of the year we saw inventory suddenly drop dramatically. This could be a precursor to increased prices as we continue into the first quarter of 2017.
The trends we see as of February 2017 include lots of buyers shopping homes that are currently on the market, as well as swarms of buyers attending open houses.
We’re also seeing buyers coming to East Contra Costa County from higher-priced cities around the San Francisco Bay Area.
So why is inventory so low? One possibility is that homes are selling so fast the inventory doesn’t increase or actually drops.
Another reason could be the unusual winter weather we’ve seen in California.
We’ve had storm after storm with many days of continuous rain and even flooding. This could be influencing people’s decision on putting their home on the market.
Is this the New Normal?
There has been much talk about changes in the behavior of buyers and sellers and how that affects the market. Studies have shown that people are staying in their homes for much longer than they used to.
The question is whether this is the new “normal” or will we eventually go back to the days when homes sold quickly and more houses were on the market at any given time. In the meantime, it is a very interesting market.
Quick Market Statistics Report for August 2016
This report is going to be very quick!
Median prices are slightly up in some markets and down in others since last month. Next month we will be taking a look at the last 6 months in price activity to get a better feeling for the market.
Other indicators are remaining pretty much unchanged.
Just click on our Inventory Report & Median Prices Report links below to check out the details.
Active Listings, Short Sales & Foreclosures
Inventory Report
Median Listings Sold Prices
Median Prices Report


