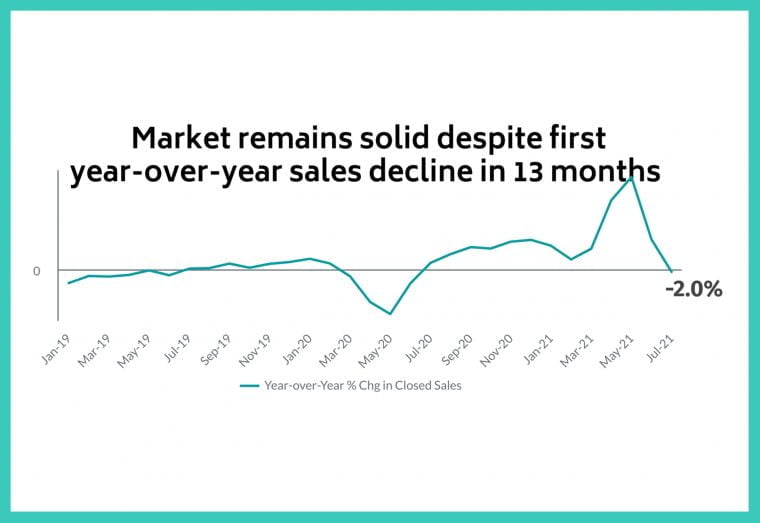
The housing market in California has been red hot since last July (2020) with home sales for the first half of 2021 surging above last year by 34 percent.
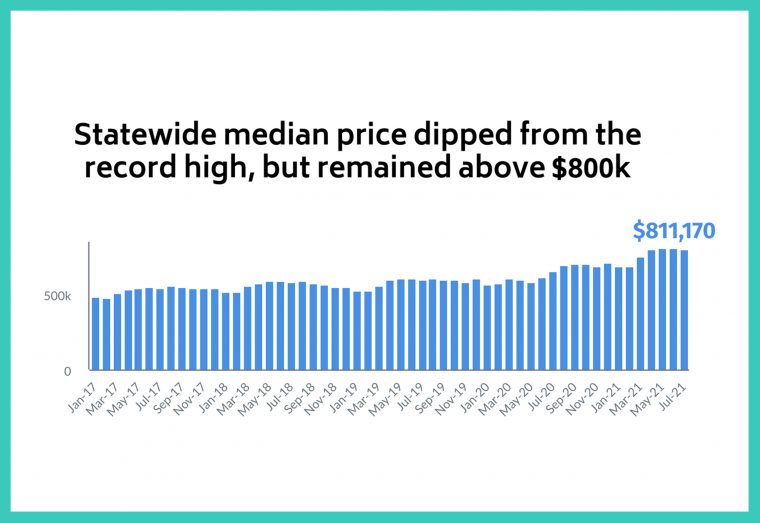
Home prices, meanwhile, continue to climb with the statewide median price-setting record a high of $811,170. However, statewide median price dipped from the record high in May but remained above $800k
On the other hand, supply remained tight as for-sale properties consistently dipped below year-ago levels by 40 to 50 percent in the first half of the year. Active listings in July were down 14.7% from last year.
The imbalance between supply and demand has created headaches for homebuyers, as market competition remains intense while housing affordability continues to decline.
Half of all new listings in the second quarter of 2021 were off the market within seven or eight days after being listed, and 70 percent of the homes were sold above their asking price.
In addition, we hit an all-time high price per square foot of $394. Of course, this is a statewide number and may vary from city to city.
Despite the impressive performance in the first six months of the year, the market momentum appears to be slowing as we move into the third quarter.
According to the latest housing report released by the California Association of REALTORS® (C.A.R.), statewide home sales declined on a month-to-month basis for the second straight month in June, while pending sales dipped for the first time since May 2020.
The housing market is showing signs of cooling down as we enter the fall season.
The market cool-off could be a sigh of relief for potential homebuyers, however. As the market resumes its seasonal normality, the housing supply will likely decrease in the fourth quarter as the market enters the holiday season.
Assuming that the market follows a typical seasonal pattern this year, supply should improve further following the end of the summer with active listings rising 4.3 percent in July and another 1.3 percent in August.
With inventory inching up and demand slowing as the market reaches the end of a traditional buying season, market competition should cool off in the coming months.
For sale properties, for example, should have a longer shelf life in the “off-season”. New listings tend to tend down during the holidays which makes it an excellent time to list your home for sale.
The median days on market should increase an average of five days in September when compared to June, based on pre-pandemic market trends observed between 2015 and 2019.
The sales-price-to-list-price ratio – another measure of market competitiveness, is also expected to come down for the rest of the year.
Between 2015 and 2019, the ratio declined an average of 0.98 percent from June to September and dropped an average of 0.55 percent from September to December.
With the pace of the economic recovery likely to slow in the second half of the year, interest rates may inch up but should not rise rapidly in the short term. As you can see in the table below, current mortgage rates are still incredibly low.
Average Mortgage Rates for California, September 20th
| Loan Type | APR This Week |
| 15 Year Fixed Conforming | 2.379% |
| 15 Year fixed Jumbo | 2.703% |
| 30 Year Fixed Conforming | 3.029% |
| 30 Year Fixed Jumbo | 3.092% |
| 5/1 Year ARM Conforming | 2.702% |
| 5/1 Year ARM Jumbo | 2.856% |
Higher inflation observed in the recent months will put upward pressure on rates, but the average 30-year fixed-rate mortgage should remain below 3.25 percent at the end of the year.
As the market takes a breather in the coming months and rates remain near record lows, homebuyers who missed the opportunity earlier will have another chance to test the market (and their luck) again.
Can We Call It a Bubble?

California had set a new record for home prices, rising by almost 25% from the same time last year to a median of almost $760,000 in May.
Does that mean that the market is in another bubble?
Price growth has certainly accelerated as 9 months of rebounding home sales has taken a tremendous toll on housing inventory. However, much of the increase in home prices can be explained by 3 factors: inflation, falling interest rates, and income growth.
Since the end of the 1980s, home prices in California have more than quadrupled from less than $200,000 for the typical single-family residence to over $800,000. However, interest rates during that time exceeded 10%.
As interest rates have fallen to around 3%, it has reduced the monthly burden on payments for each dollar borrowed, which has enabled would-be homebuyers to qualify for and borrow more money from the bank.
Converting prices (which don’t account for rates) into monthly mortgage payments (which do), California is still more than 10% below its 2006 peak.
In addition, general inflation has increased both incomes as well as the cost of goods and services in California.
According to the California Consumer Price Index (CPI) used to calculate increases in annual property tax bills under Proposition 13, prices have increased by more than 120% since the late 1980s.
Converting monthly mortgage payments into inflation-adjusted mortgage payments allows us to compare mortgage payments from previous periods on an apples-to-apples basis as if prices had been in constant $2020 all along.

This adjustment to what economists call “real” terms shows that mortgage payments are 33% below their all-time highs from 2007 and even 10% below where they were at the end of the 1980s.
Fewer households in California can afford the median-priced home in the state because it has grown more unequal over time, but after considering interest rates, incomes, and overall inflation, mortgage payments on the median-priced home are not consuming larger shares of the incomes of those buying homes than is typical for California’s past.
California still costs more to own a home relative to other states and prices are still elevated relative to where they would be in a perfectly clearing market environment with no supply constraints.
However, the price premium above that clearing price was only slightly higher than the pre-2000 average that has persisted in California for decades.
Indeed, that premium is less than one-fifth the size that it was during 2007 when prices were more than double their market-clearing price.
That does not mean that the probability of price softening in California does not exist. Indeed, recent price and rate increases make softer growth in the fourth quarter of 2021 more likely, and C.A.R.’s forecast reflects those challenges.
However, the downside risk of such an event is much smaller in magnitude than it was during the last cycle.
As always, prospective homebuyers should always purchase homes with their eyes wide open about both the potential risks of short-run market fluctuations and the long-term benefits of homeownership.
Although the future is hard to predict, this is feeling a little like a real estate bubble. It isn’t 2008 all over again, just make sure the deal makes sense for your own personal economy.
Consult your local realtor for the best advice concerning your situation.
Our Local Real Estate Numbers
In the following charts, you’ll find the number of houses sold from February through July 2021, the average sales prices, and the median sales prices for the same time period.
Cities include Antioch (each zipcode tracked separately), Brentwood, Discovery Bay, and Oakley.
What’s the Difference Between Average Sales Price, and Median Sales Price?
Average Sales Price. The average—or “mean”—adds up all the sales prices of the homes sold during the specified period divided by the number of houses sold.
Median Sales Price. In real estate, half of the homes in an area sell above the median price, and half of the homes sell below the median price. So, the middle price.
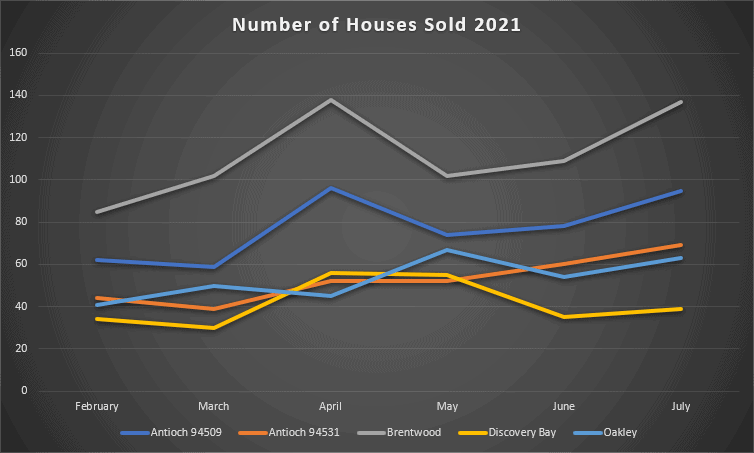
Brentwood led the area market in home sales over the period, with sales trending up in July. We expect this trend to slow down this fall.
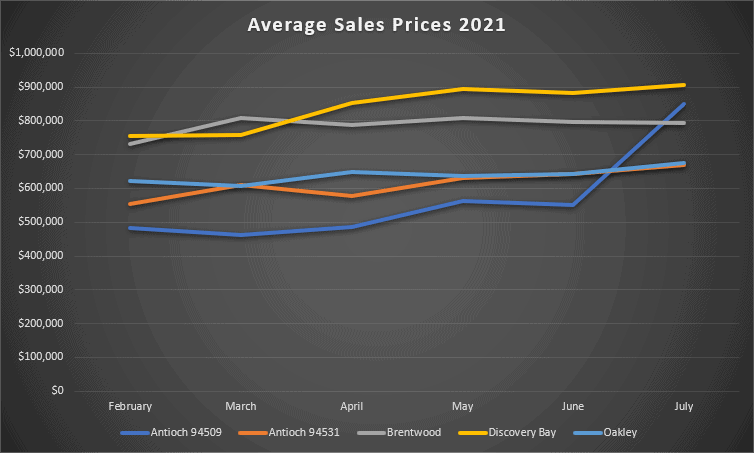
Average sales prices have generally increased so far this year. We also expect this to continue over the short term, with prices leveling out over the next few months.
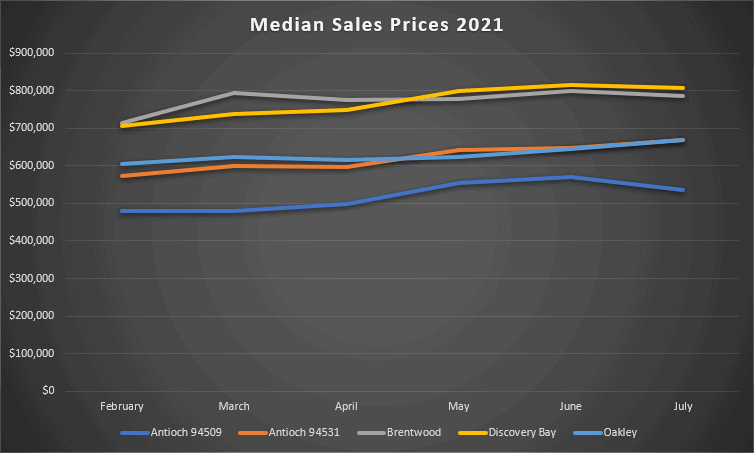
Median sales prices also slightly trended up with a general flattening in July. We also expect median sales prices to level off this fall.
Conclusion
While all of this information is relevant on a state-wide and city level, what is happening in your neighborhood will vary. We suggest you take advantage of our free home value assessment to find out where your home market value is right now.
If you have been thinking about buying a home, the next few months might be the best opportunity this year. Start preparing your purchase now to take advantage of the cooling market and possible falling home prices.
Contact us to get help with our Down Payment Resource Directory. You could be eligible for down payment assistance.
We also suggest you do a monthly check on how the market is doing on our California Housing Market Report Index page.




Leave a Reply